Sep 14, 2020, 7:41:49 AM
EUR/USD: wave analysis
The pair may grow.
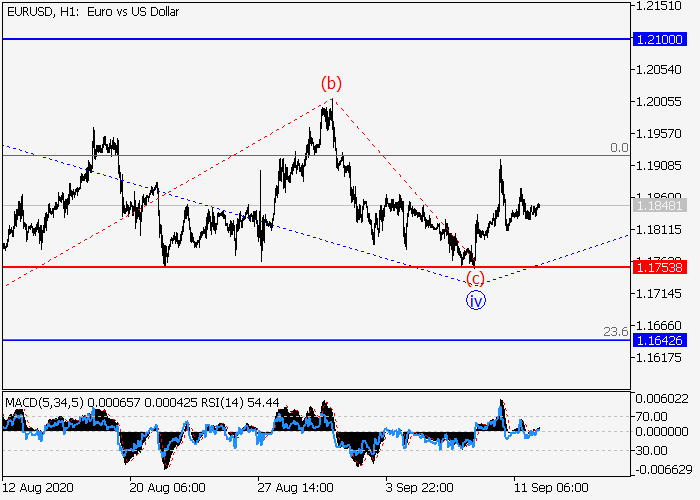
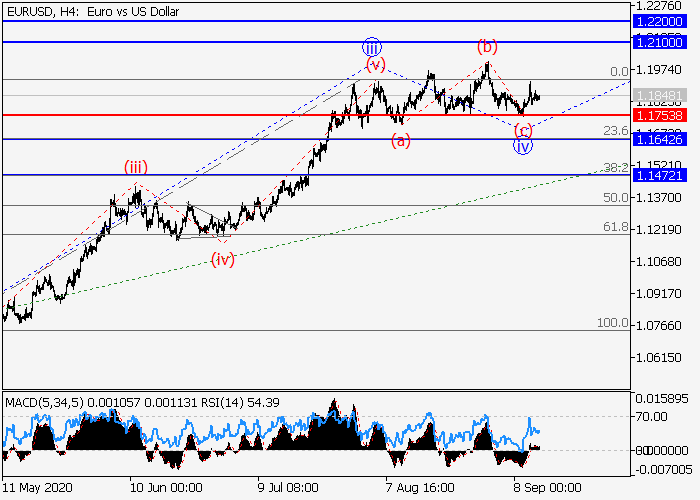
On the 4-hour chart, the first wave of the higher level 1 of (3) develops, within which the wave iii of 1 formed. Now, a local correction has developed as the fourth wave iv of 1, and the formation of the wave v of 1 started. If the assumption is correct, the pair will grow to the levels of 1.2100–1.2200. In this scenario, critical stop loss level is 1.1753.
Main scenario
Long positions will become relevant during the correction, above the level of 1.1753 with the targets at 1.2100–1.2200. Implementation period: 7 days and more.
Alternative scenario
The breakdown and the consolidation of the price below the level of 1.1753 will let the pair go down to the levels of 1.1642–1.1472.
Scenario
-
Timeframe
Weekly
-
Recommendation
BUY
-
Entry Point
1.1850
-
Take Profit
1.2100, 1.2200
-
Stop Loss
1.1753
-
Key Levels
1.1472, 1.1642, 1.1753, 1.2100, 1.2200
Alternative scenario
-
Timeframe
Weekly
-
Recommendation
SELL STOP
-
Entry Point
1.1750
-
Take Profit
1.1642, 1.1472
-
Stop Loss
1.1810
-
Key Levels
1.1472, 1.1642, 1.1753, 1.2100, 1.2200